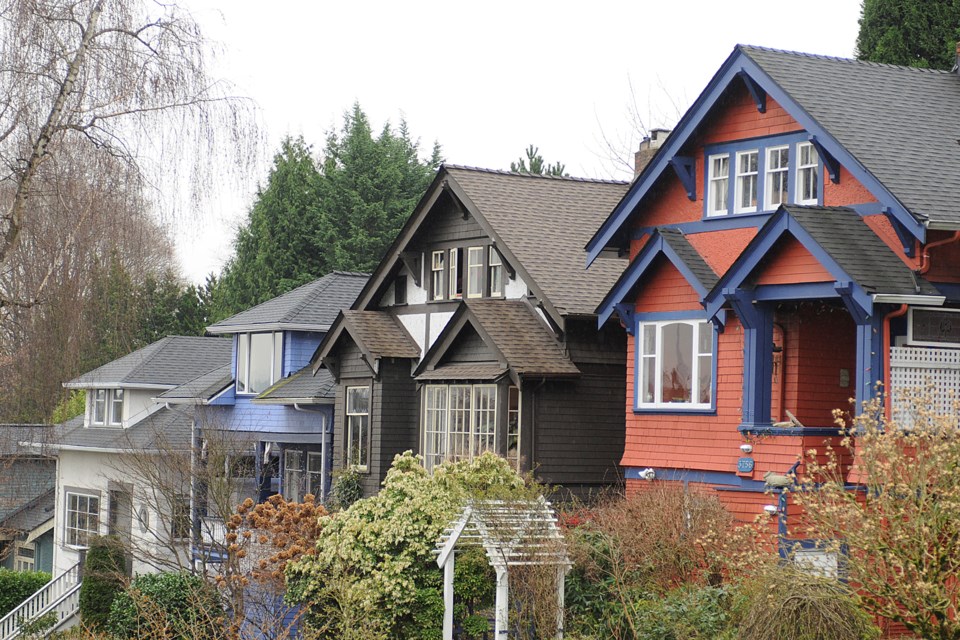
In a month that usually starts picking up in terms of sales activity ahead of the spring market, detached home sales in Metro Vancouver saw a considerable slump in February, according to the latest statistics.
Detached sales were down 39.4 per cent below the 10-year sales average for February and sales of attached houses such as townhomes, row homes and duplexes were also 6.8 per cent lower than the 10-year average, the Real Estate Board of Greater Vancouver reported March 2.
However, it was a different story for condos, with February’s sales 5.5 per cent above the 10-year average for the month.
Despite the condo market’s strong performance, it was a weak February overall, as new mortgage qualification rules, rising interest rates and policy-related uncertainty took their toll. There were 2,207 home sales on the Greater Vancouver MLS® in February, which is 21.4 per cent higher than January, but a 9 per cent decrease from the 2,424 sales recorded in February 2017, and 14.4 per cent below the 10-year February sales average (see interactive graph below).
(Story continues below)
Jill Oudil, REBGV president, said, “Rising interest rates and stricter mortgage requirements have reduced home buyers’ purchasing power, particularly for those at the entry level of our market. Even still, the supply of apartment and townhome properties for sale today is unable to meet demand. On the other hand, our detached home market is beginning to enter buyers’ market territory.”
Some 4,223 Metro Vancouver homes were listed last month, which is a 15.2 per cent increase compared with February 2017 and an 11.2 per cent increase over January 2018, when 3,796 homes were listed. With the slow absorption of these new listings, that brings the total number of homes listed for sale on the MLS® system as of the end of February to 7,822 units – a 3 per cent increase year over year, and a 12.6 per cent increase since the end of January 2018.
Across the three property types, the sales-to-active listings ratio for February 2018 is 28.2 per cent, which is still a seller’s market overall. However, it is wildly different between property types, with the ratio is 13 per cent for detached homes (a buyer’s market), versus 37.6 per cent for townhomes and 59.7 per cent for condominiums (both strong seller’s markets, the latter indicating very high demand and low supply, where sellers can expect bidding wars and over-asking offers).
Oudil added, “The spring is traditionally the busiest time for home buyers and sellers in our market. We’ll wait to see how they react to the taxes and other policy measures that our provincial and federal governments have introduced so far this year.”
The composite benchmark price for all resale homes in Metro Vancouver rose once more, now at $1,071,800 – a 16.9 per cent increase over February 2017 and a 1.4 per cent increase compared to January 2018. Again, this growth is very different between the three home types and between various cities and neighbourhoods.
Sales and prices by home type
Single-family home sales took a battering in February, totalling just 621 sales, down 16.6 per cent year over year. And that’s in comparison with what was itself a weak February one year ago, following the 2016 introduction of the foreign buyer tax. However, the total is higher than the 487 detached sales in January this year.
The board’s benchmark sale price for a detached home is $1,602,000, which is 8.2 per cent higher than February 2017 and just $500 higher than January 2018, but lower than in December 2017.
Sales of attached properties such as townhouses and duplexes saw a less-alarming annual decline, with February’s 401 sales a slight drop of 0.7 per cent year over year, and up 26.6 per cent since January. The benchmark attached-home price rose 18.1 per cent year over year, and 1.9 per cent month over month, to $819,200.
Despite high demand – and perhaps because of the apparent lack of inventory – condo sales in February saw a steeper yearly decrease of 7.1 per cent, with 1,185 units sold. That’s 17 per cent more than were sold the previous month.
That high demand was more evident in the growth in the condo benchmark price. At a record $682,800 across Metro Vancouver, this typical price is 27.2 per cent more than February last year, and up 2.6 per cent in the single month since January.
Home prices vary widely in different areas throughout the REBGV region. To get a good idea of home prices in a specific location and by property type, check the detailed MLS® Home Price Index in the REBGV full statistics package.


