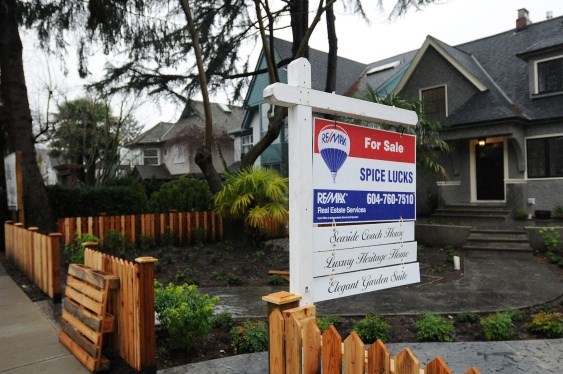
September is usually the month that we’d expect to see real estate activity start to pick up after a summer break – but there's no sign of that this year, new statistics from the Real Estate Board of Greater Vancouver reveal.
There were just 1,595 home sales in Metro Vancouver in September 2018, which is a dramatic 43.5 per cent decrease from the 2,821 sales in September 2017, and an even more surprising 17.3 per cent month-over-month drop since August this year.
The total is also 36.1 per cent below the 10-year average number of home sales for September.
The numbers certainly place a question mark over the B.C. Real Estate Association's recent assertion that the slowdown in sales across the province so far this year is "largely behind us" and that activity is likely to pick up this fall. Those numbers were soon contradicted by the Canadian Real Estate Association, which predicted slower sales in B.C. this fall.
Metro Vancouver's lack of sales activity in September has pushed the number of homes for sale on the MLS in the region to 13,084, which is a 38.2 per cent rise over September 2017, and up 10.7 per cent from August 2018.
Overall, that puts Metro Vancouver real estate into a balanced market, but rapidly moving towards a buyer’s market, with a sales-to-active listings ratio of 12.2 per cent (a balanced market is 12 to 20 per cent over a sustained period). The region’s detached homes are already in a stronger buyer’s market at just 7.8 per cent, with more balanced markets for townhomes at 14 per cent, and condos at 17.6 per cent.
The slowdown has seen benchmark prices continue to slide off their peak earlier this year, with the composite benchmark home price now just 2.2 per cent higher than in September 2017. The current composite benchmark of $1,070,600 is 3.1 per cent lower than three months ago.
Ashley Smith, REBGV’s new president-elect, said, “Fewer home sales are allowing listings to accumulate and prices to ease across the Metro Vancouver housing market. There’s more selection for home buyers to choose from today. Since spring, home listing totals have risen to levels we haven’t seen in our market in four years.”
Sales and prices by property type and region
After many months of market activity deeply divided by property type, townhomes and condos seem to be finally succumbing to the sales slowdown that has dogged the detached home sector over the past year or so. However, with attached property trends trailing those of the single-family home, their prices have not yet seen the same declines.
Just 508 single-family homes traded hands across Metro Vancouver in September, which is a 40.4 per cent drop from one year previously, and down 11 per cent from August. The benchmark price for detached properties is $1,540,900, which is a 4.5 per cent decrease from September 2017 – the only property type to see prices lower than a year ago – and a drop of 3.4 per cent in three months.
The worst-hit areas for value declines in the detached sector were West Vancouver, where benchmark prices are down 11.4 per cent year over year, and Vancouver West, down 10.9 per cent. New West detached prices did a little better than the regional benchmark, down 1.8 per cent. Detached prices in Maple Ridge, Whistler, Pitt Meadows, Sunshine Coast, Squamish, Bowen Island and the Tri-Cities all remained higher than a year ago – although homes in even these resilient areas are off their spring peak prices.
Townhome activity saw the biggest annual slump, with a mere 275 sales in September, which is a whopping 46.9 per cent lower than September 2017, and a slide of more than 18 per cent from August. The price of a typical townhome (or similar attached property) in the region is now $837,600, which is still 6.4 per cent higher than September 2017, but a two per cent drop over the last three months.
Vancouver West – which includes the West Side, Downtown West and the West End – was the only area to see townhome prices lower than one year ago, down 2.8 per cent year over year and nearly six per cent lower than three months ago. New Westminster is bucking the trend, with price increases in the townhome sector up 9.2 per cent.
After a long reign as the most resilient sector, condos are now suffering a similar fate, with a 44 per cent annual drop in sales, at 812 units in September. That’s the steepest month-over-month activity decline, down more than 20 per cent from August’s condo sales. Benchmark prices have also continued to fall off the peak seen in the spring for this home type.
The price of a typical Metro Vancouver condo is now pegged at $687,300, which is a 7.4 per cent increase from September 2017 and a 3.1 per cent decrease over the last three months. Once more, however, this varies hugely depending on your local market.
Although Whistler is leading the pack for single-family home prices, it was the only area in the Greater Vancouver board’s jurisdiction to see an annual price decline in its condo market, with the benchmark price one per cent lower than a year ago and an eyebrow-raising 10.1 per cent lower than its peak price earlier this year. Vancouver West didn’t do much better, with condo prices up only one per cent since last September, and down 5.6 per cent in the past three months. New West's condo prices are outperforming the regional trend, up 12.4 per cent year over year.
Home prices vary widely in different areas throughout the region. To get a good idea of home prices in a specific location and by property type, check the detailed MLS® Home Price Index in the full REBGV stats package.


